

Note
Go to the end to download the full example code.
Working with RegionOfInterest objects#
Import our packages We can import a variety of neo objects from neo.core and since an ImageSquence also uses units let’s import quantities which is the “units” library that neo uses under the hood
import matplotlib.pyplot as plt
import numpy as np
from neo.core import CircularRegionOfInterest, RectangularRegionOfInterest, PolygonRegionOfInterest, ImageSequence
from numpy.random import rand
import random
import quantities as pq
First we create our image_sequence. Let’s generate some data In this simulated dataset we will just make an image that is 100x100 pixels and then we will make 50 frames of this image finally we will fill with random values for the data
l = []
for frame in range(50):
    l.append([])
    for y in range(100):
        l[frame].append([])
        for x in range(100):
            l[frame][y].append(random.randint(0, 50))

# make an ImageSquence in Neo
image_seq = ImageSequence(l, sampling_rate=500 * pq.Hz, spatial_scale="m", units="V")
Now we will write a function for plotting an roi
def plot_roi(roi, shape):
    img = rand(120, 100)
    pir = np.array(roi.pixels_in_region()).T
    img[pir[1], pir[0]] = 5

    plt.imshow(img, cmap="gray_r")
    plt.clim(0, 5)

    ax = plt.gca()
    ax.add_artist(shape)
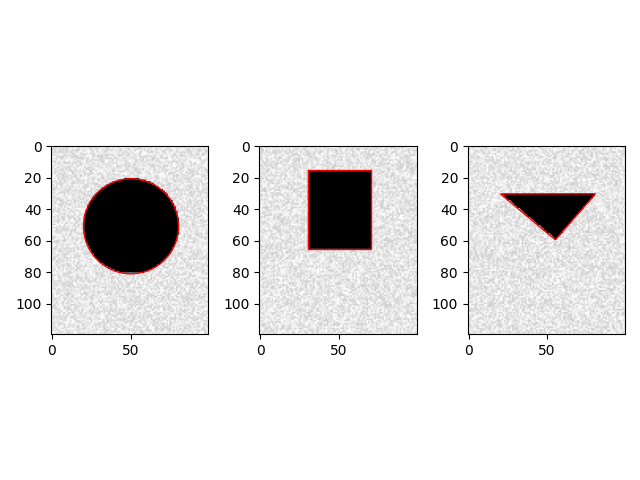
Finally we will plot each roi to demonstrate how we could high regions of interest
# First a nice circle
roi = CircularRegionOfInterest(image_sequence=image_seq, x=50.3, y=50.8, radius=30.2)
shape = plt.Circle(roi.centre, roi.radius, color="r", fill=False)
plt.subplot(1, 3, 1)
plot_roi(roi, shape)

# Next a rectangle
roi = RectangularRegionOfInterest(image_sequence=image_seq, x=50.3, y=40.2, width=40.1, height=50.3)
shape = plt.Rectangle((roi.x - roi.width / 2.0, roi.y - roi.height / 2.0), roi.width, roi.height, color="r", fill=False)
plt.subplot(1, 3, 2)
plot_roi(roi, shape)

# Finally we can make a polygon (in this case a triangle)
roi = PolygonRegionOfInterest(image_seq, (20.3, 30.2), (80.7, 30.1), (55.2, 59.4))
shape = plt.Polygon(np.array(roi.vertices), closed=True, color="r", fill=False)
plt.subplot(1, 3, 3)
plot_roi(roi, shape)

plt.tight_layout()
plt.show()
Total running time of the script: (0 minutes 0.427 seconds)