

Note
Go to the end to download the full example code.
Analyzing and Plotting Data with Neo Structures#
First we import some packages. Since we are making simulated data we will import quite a few neo features as well as use quantities to provide units
from itertools import cycle
import numpy as np
from quantities import ms, mV, kHz
import matplotlib.pyplot as plt
from neo import Block, Segment, ChannelView, Group, SpikeTrain, AnalogSignal
For Neo we start with a block of data that will contain segments of data so we will create a block of probe data that has a couple tetrodes Then we will load in 3 segments (for examples trials of a stimulus)
store_signals = False

block = Block(name="probe data", tetrode_ids=["Tetrode #1", "Tetrode #2"])
block.segments = [
    Segment(name="trial #1", index=0),
    Segment(name="trial #2", index=1),
    Segment(name="trial #3", index=2),
]

# we will decide how many units each tetrode has found. If only science was this easy
n_units = {"Tetrode #1": 2, "Tetrode #2": 5}
Neo can also have groups. Groups are structures within a block that can cross segments for example we could group a neuron across trials or across probes.
# Create a group for each neuron, annotate each group with the tetrode from which it was recorded
groups = []
counter = 0
for tetrode_id, n in n_units.items():
    groups.extend([Group(name=f"neuron #{counter + i + 1}", tetrode_id=tetrode_id) for i in range(n)])
    counter += n
block.groups.extend(groups)

iter_group = cycle(groups)
Segments are also containers of data. Segments can hold raw signal data like an AnalogSignal Segments can also hold spiketrain data (in a SpikeTrain). It can also hold event data (which we are not show in this example)
# Create dummy data, one segment at a time
for segment in block.segments:

    # create two 4-channel AnalogSignals with simulated data (because we have two tetrodes!)
    # note that the AnalogSignal with have numpy array-like data with units and sampling rates
    # Neo keeps track of these units while also giving you the flexibility of treating the raw data
    # like a numpy array
    signals = {
        "Tetrode #1": AnalogSignal(np.random.rand(1000, 4) * mV, sampling_rate=10 * kHz, tetrode_id="Tetrode #1"),
        "Tetrode #2": AnalogSignal(np.random.rand(1000, 4) * mV, sampling_rate=10 * kHz, tetrode_id="Tetrode #2"),
    }
    if store_signals:
        segment.analogsignals.extend(signals.values())

    # create spike trains with simulated data
    # we will pretend the spikes have been extracted from the simulated signal
    for tetrode_id in ("Tetrode #1", "Tetrode #2"):
        for i in range(n_units[tetrode_id]):
            spiketrain = SpikeTrain(np.random.uniform(0, 100, size=30) * ms, t_stop=100 * ms)
            # assign each spiketrain to the appropriate segment
            segment.spiketrains.append(spiketrain)
            # assign each spiketrain to a given neuron
            current_group = next(iter_group)
            current_group.add(spiketrain)
            if store_signals:
                # add to the group a reference to the signal from which the spikes were obtained
                # this does not give a 1:1 correspondance between spike trains and signals,
                # for that we could use additional groups (and have groups of groups)
                current_group.add(signals[tetrode_id])
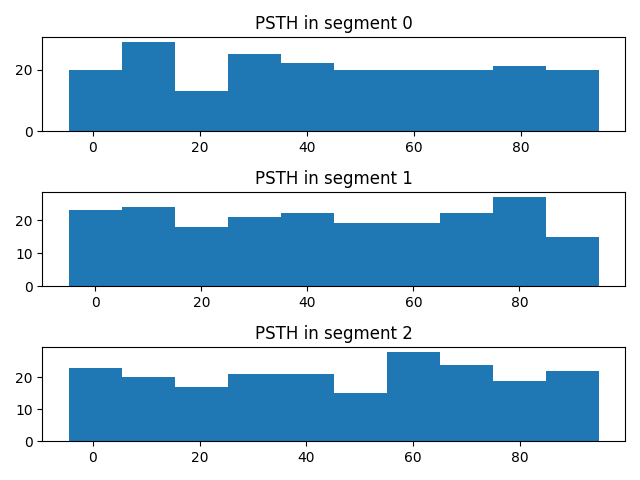
Now we will plot the data Neo doesn’t provide it’s own plotting functions, but since its data can be treated like numpy arrays it is easy to use standard packages like matplotlib for all your plotting needs We do a classic in neuroscience and show various ways to plot a PSTH (Peristimulus histogram)
plt.figure()
for seg in block.segments:
    print(f"Analyzing segment {seg.index}")
    stlist = [st - st.t_start for st in seg.spiketrains]
    plt.subplot(len(block.segments), 1, seg.index + 1)
    count, bins = np.histogram(stlist)
    plt.bar(bins[:-1], count, width=bins[1] - bins[0])
    plt.title(f"PSTH in segment {seg.index}")
plt.tight_layout()
plt.show()
Analyzing segment 0
Analyzing segment 1
Analyzing segment 2
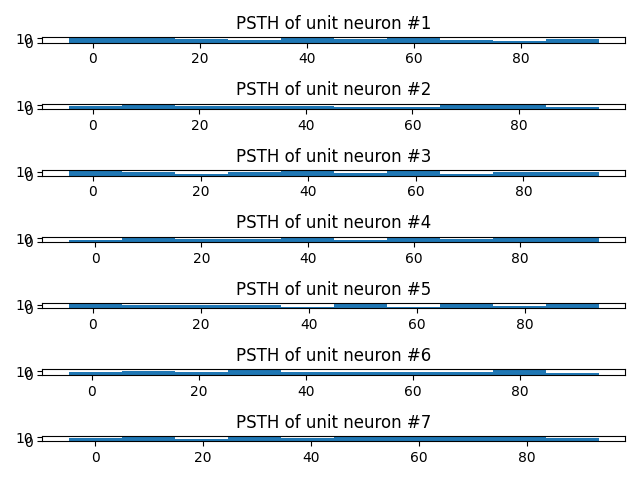
..by neuron
plt.figure()
for i, group in enumerate(block.groups):
    stlist = [st - st.t_start for st in group.spiketrains]
    plt.subplot(len(block.groups), 1, i + 1)
    count, bins = np.histogram(stlist)
    plt.bar(bins[:-1], count, width=bins[1] - bins[0])
    plt.title(f"PSTH of unit {group.name}")
plt.tight_layout()
plt.show()
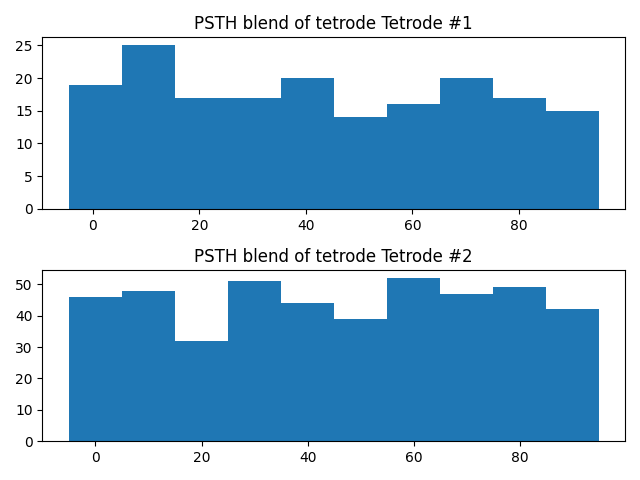
..by tetrode (or other electrode number)
plt.figure()
for i, tetrode_id in enumerate(block.annotations["tetrode_ids"]):
    stlist = []
    for unit in block.filter(objects=Group, tetrode_id=tetrode_id):
        stlist.extend([st - st.t_start for st in unit.spiketrains])
    plt.subplot(2, 1, i + 1)
    count, bins = np.histogram(stlist)
    plt.bar(bins[:-1], count, width=bins[1] - bins[0])
    plt.title(f"PSTH blend of tetrode {tetrode_id}")
plt.tight_layout()
plt.show()
Total running time of the script: (0 minutes 0.754 seconds)